


Control your graphics live
Create and take HTML5 graphics on air
Bring data to life with the Graphics Builder
Control your graphics live
Create and take HTML5 graphics on air
Designed by Those Who Create Graphics for TV
XTV Graphics is an HTML5 graphics system that brings graphics, data, and control together, from creation to broadcast. Create layouts in the Graphics Builder, connect text, images, and tables, and manage animations and playlists during live production.
- Graphics Builder for creating your layouts
- Animated graphics in the browser
- Reusable styles across productions
- Live control and playlists for broadcast
- API server for making your data available
- Data ingestion and orchestration from APIs and RSS

Reusable styles
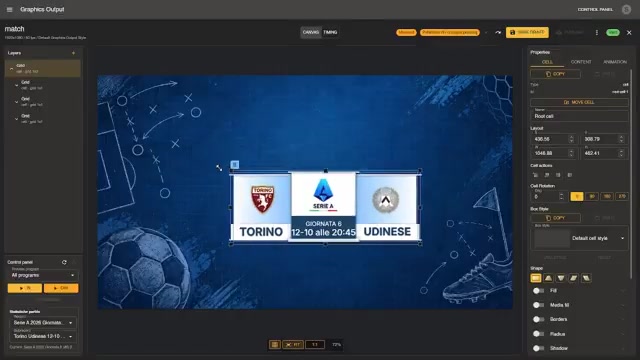
Graphics Builder
Animated graphics
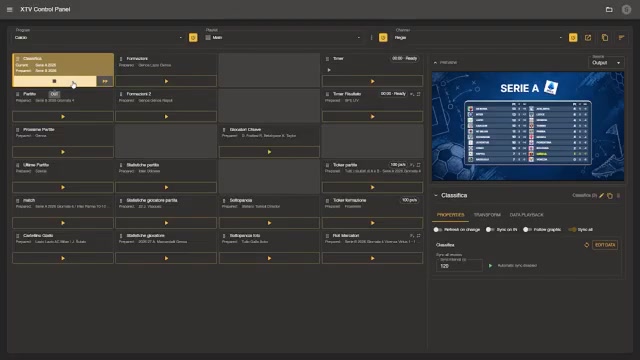
Live control and playlists
Live data and API server
HTML5 output
Reusable styles
Graphics Builder
Animated graphics
Live control and playlists
Live data and API server
HTML5 output
Create, connect, and take graphics on air
From layout design to live control, XTV Graphics gives you the tools to create graphics, connect them to data, and manage them during production.
Graphics Builder
Build layouts and connect graphic elements to text, images, and tables.
Live data and API server
Manage content, ingest data from APIs and RSS feeds, and make it available through XTV endpoints.
Animated graphics
Set entry and exit animations for your on-air content.
Live control and playlists
Prepare your graphics sequence and control what appears during the live broadcast.
Reusable styles
Reuse fonts, colors, and style settings to keep your graphics consistent across productions.
HTML5 output for live production
Animated HTML5 output available through a URL. Use it as a browser source in compatible software and overlay graphics on video with a transparent background.
Programs, users, and roles
Organize content and access by program, assigning each user a role.
Graphics, data, and control work together: prepare content, reuse layouts, and manage your on-air graphics from a single environment.



Get the latest news on the XTV graphics system

XTV with other graphics software
Already have a graphics system? Use XTV to orchestrate your data: centralize content and make it available to your software through APIs or files.
Data orchestration
Manage text, images, and tables in a shared database organized for your productions.
Data ingestion from APIs and RSS
Connect external sources to keep the data feeding your graphics up to date.
APIs for other software
Make XTV data available through endpoints that connect to your graphics system.
File exports
Prepare Excel (XLSX), CSV, XML, JSON, or TXT outputs in the formats your workflow requires.
Data and images on your PC
Use XTV Station to synchronize files and images locally, where your graphics software can read them.
The same content on the web
Reuse the XTV database to feed your website and digital channels alongside your TV graphics.


The same data, on air and on WordPress
With XTV for WordPress, reuse your graphics database to feed web pages, news, statistics, and dynamic content. Update data in XTV to keep your production and website connected.
- Dedicated Gutenberg blocks for records, templates, and dynamic views
- Support for XTV text, images, tables, and nested records
- Content connected to the data source and ready for automatic updates
Feel free to messege
Get in touch
We are here to help! If you have any questions, requests, or simply want more information about our services, don't hesitate to reach out. Our team is always ready to meet your needs.
Address
Via Cipro, 4 - 16129 Genova - ItalyEmail Address
info@xtvgraphics.comPhone number
+39 010 459 2277LinkedIn
XTV Graphics